Data analysis is the process of developing answers to questions or issues through the examination and interpretation of data.
It involves presenting data findings in a way that supports policy and decision making and is easy to interpret,
In short, data analysis makes data more meaningful. It is the principal tool for obtaining information from data.
The basic steps in the analysis process include:
- Identifying objectives of the analysis or issues (what issues am I addressing?)
- Determining the availability of suitable data (what data am I using?)
- Deciding which analytical methods are appropriate for addressing the issues of interest (what statistical techniques are appropriate?)
- Applying the methods and evaluation, summarizing and communicating the results.
- And knowing your target audience (who is interested in this issue and why?)
Analytical results underscore the usefulness of data sources by shedding light on relevant issues. For example, some National Statistics Office programs depend on analytical output as a major data product as due to confidentiality concerns it is not possible to release the microdata to the public.
Data Analysis also plays a key role in data quality assessment by pointing to data quality problems for instance in a given census or Household Income and Expenditure (HIES) survey. Thus, analysis can influence future improvements to the Census or HIES survey.
Moreover, data analysis is important for providing information on data gaps, for designing and redesigning surveys, for planning new statistical activities, for formulating quality objectives and for supporting policy and decision making.
Data analysis is also essential for understanding results from surveys, administrative sources and pilot/case studies. For example, results of data analysis from census and HIES survey are often published or summarized in official National Statistic Offices Releases.
Similarly, results of data analysis from administrative sources are often published and summarized in Central or Reserve Banks and other agency publications.
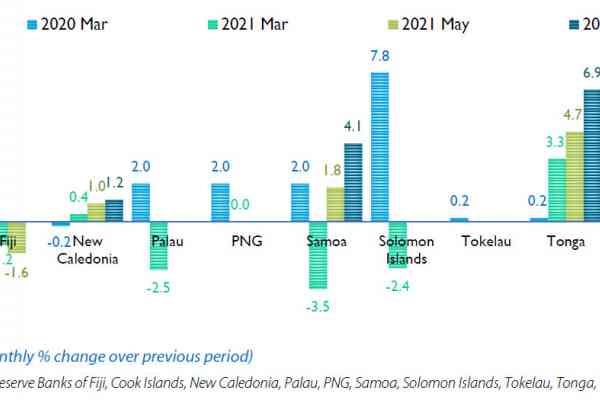
At Pacific Community (SPC), regional economic indicators analysis such as the impacts of covid-19 on Pacific Island Countries and Territories drawn from national administrative sources are published online on the Statistics for Development division and Pacific Data Hub websites. An example of an analysis report using administrative data is accessible in this link: Q3 2021 Economic Impact of COVID-19 on PICTS.
Analytical studies may be also useful in explaining the behaviour of and relationships among characteristics. For example, a study of risk factors for obesity in Pacific Islands Children would be analytic.
For effective data analysis, it is important to understand the relevant issues both current and likely to emerge in the future, and how to present the results to the audience.
Having background information allows us to choose suitable data sources and appropriate statistical methods. Hence, any findings or conclusions presented in an analysis including those that can impact policy and decision making must be supported by the data being analysed.