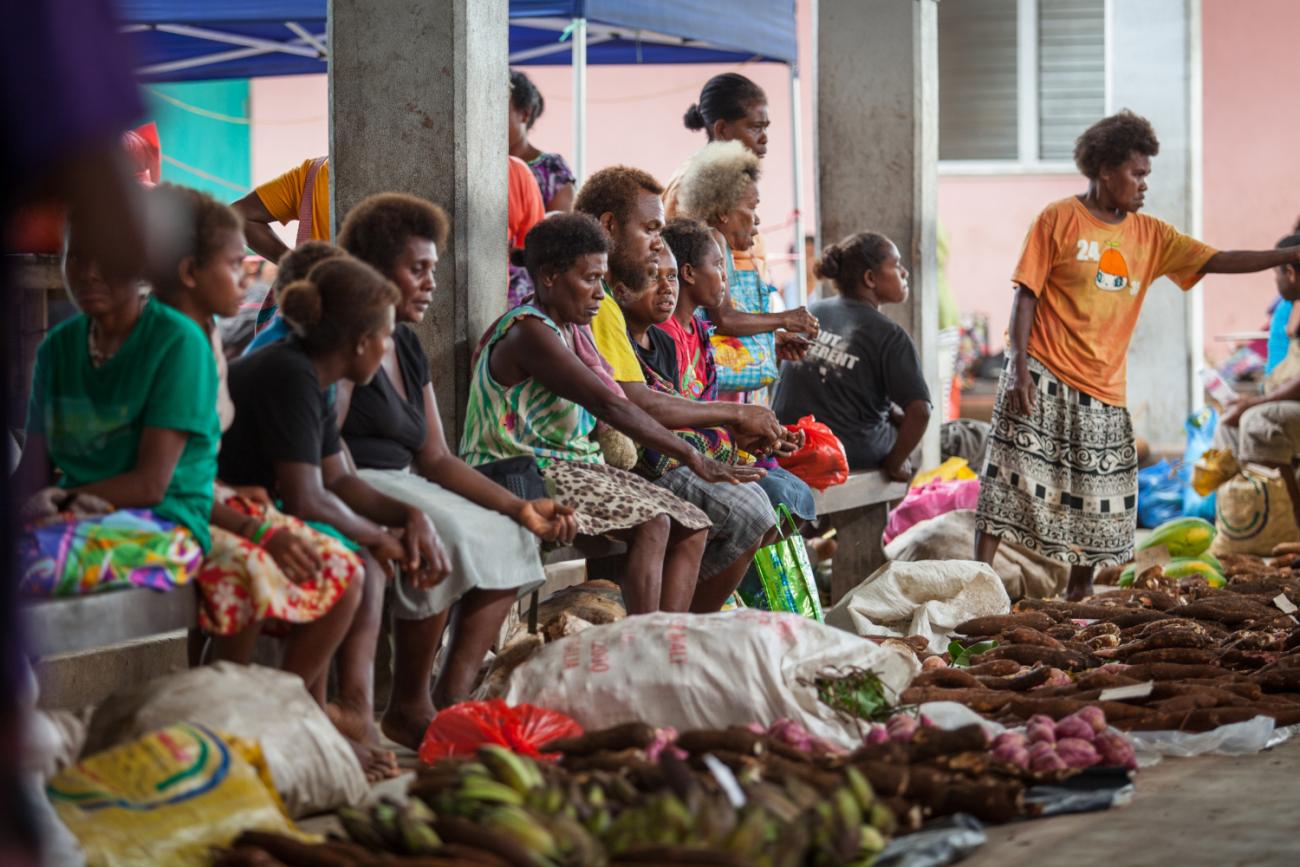
Image: Vegetables stalls at Auki market, Malaita Province, Solomon Islands. Credit: Filip Milovac, WorldFish
The term “food systems” refers to the web of actions and interactions involving the production, processing, transport, trade, marketing and consumption of the food we eat, and surrounding biophysical and socioeconomic environments - and they are complex.
To untangle this web and reveal a picture of the current state of the food system, how it looked in the past, and how it is likely to be shaped in the future, data are vital.
Using data to describe food systems clearly allows us to develop better policies for sustainable and resilient food systems.
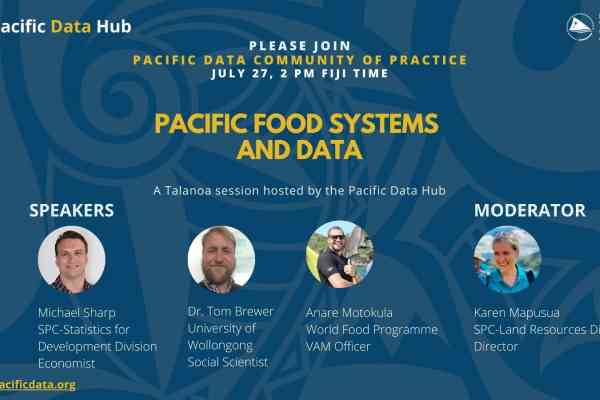
At a recent “Pacific Data Community of Practice” * Talanoa focused on food systems, Michael Sharp, Economic Statistics and Microdata Specialist working for the Statistics for Development Division of the Pacific Community (SPC) outlined why data is essential in this space.
“To measure and form a picture of food systems we can use agricultural data to view production over time, trade data helps us see trends in exports and imports, and consumption data reveals who is eating what. Without data we can do none of this. Without data we are blind,” said Michael.
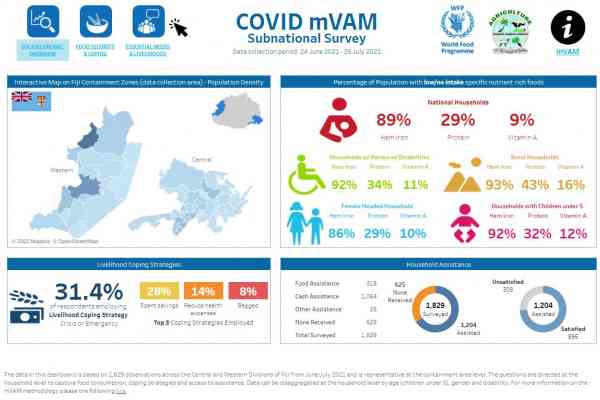
Using consumption data as an example, Michael pointed out that working with this data enables us to better understand food consumption patterns of Pacific people. This includes factors such as how much dietary energy they are consuming and their access to various the macro and micronutrients that are essential for growth and good health.
“Monitoring health data is in one way for us to get an idea of consumption”, said Michael.
“Health is of course complex and multifaceted, but a large part of our health is the food we eat. In the Pacific with dietary related non-communicable diseases, understanding consumption patterns and drivers of consumption are important to developing policy to try to support alleviation of non-communicable diseases in the region”, he said.
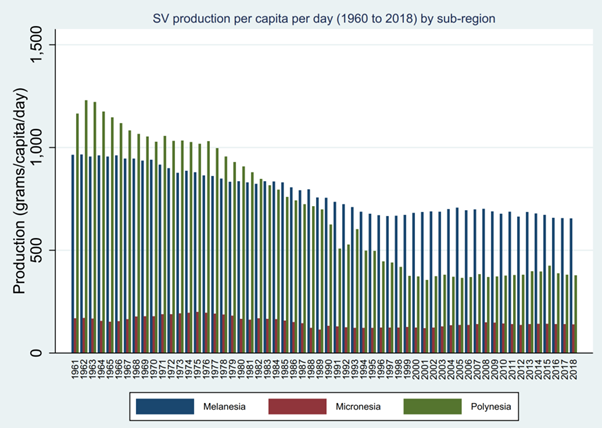
Data is useful in that it reveals trends, patterns and stories. Using agricultural production data as an example, Michael pointed out, how, over time, it is possible to see a per capita decline in agricultural production in the region since the 1960’s.
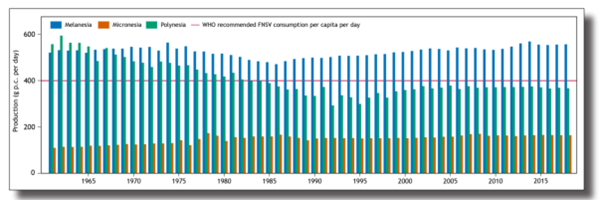
“When we talk about food production, we are looking at things like starchy vegetables which are the traditional staples of the Pacific diet including, cassava, kumara, taro and cooking banana. According to the data, per capita production of these is generally declining.”
The production of fruit and non-starchy vegetables, which are essential for access to micronutrients are also generally in decline on a per-capita basis. There has also been an increase in cash crop production such as the growing of coffee, kava, cocoa and oil crops.
“I would suggest there’s probably been a bit of a shift in production away from food towards cash crops. In terms of food security that puts the Pacific countries at risk as it makes them more dependent on international food supplies”, said Michael.
Data on Pacific coastal fisheries, while incomplete, suggests a similar trend with fisheries for food production declining.
“This points to a real shift from traditional agricultural production systems and traditional food sovereignty to a food system that is quite dependant on international markets”, Michael added.
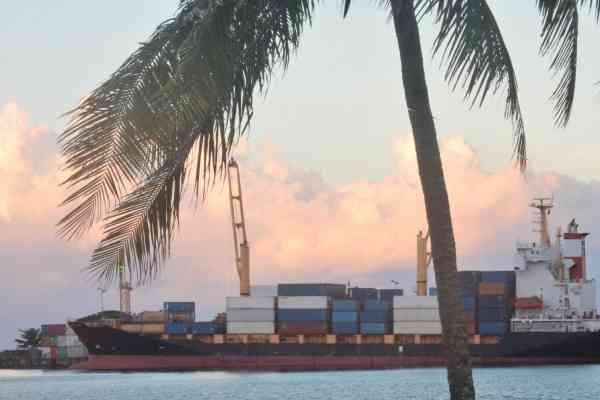
“And when we overlay trade data it further supports this hypothesis that we are seeing increased quantities of food being imported into the Pacific over the past couple of decades,” he said.
This decline in agricultural production per capita coupled with an increase in export demand for traditional food from Pacific people living abroad means locally grown traditional crops are less available and affordable; this pattern is also contributing to a shift in Pacific diets.
“We can see a shift away from consumption of traditional and locally produced root crop and fish to energy dense imports. This has impacts on people’s health. The Pacific has high degrees of non-communicable disease such as hypertension, diabetes and cardiovascular disease and many of these are diet related. There is definitely a need for innovative solutions.” said Michael.
While the search for innovative solutions is an ongoing and ever evolving challenge, it is data that will help us find them. Using data to understand, analyse and formulate policy allows us to see where we have been, where we are and set a course for where we want to go. Ultimately, data can help improve people’s lives.
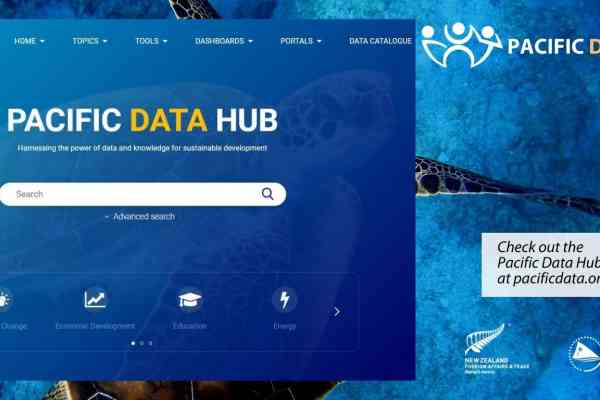
About the Pacific Data Hub (PDH)
The Pacific Data Hub (PDH) is a central repository of data about the Pacific and from the Pacific. The platform serves as a gateway to the most comprehensive collection of data and information about the Pacific across key areas including population statistics, fisheries science, climate change adaptation, disaster risk reduction and resilience, public health surveillance, conservation of plant genetic resources for food security and human rights.
Story written by David Wardell, Corporate Communications Office